
Jordan Becker · 5 October 2026
Pelena's Traffic Upgrades Spark Unexpected Shifts in Local Delivery Patterns
Pelena implemented a series of traffic upgrades throughout 2025 and into October 2026 that included new roundabouts, dedicated bus lanes, and synchronized traffic signals across key corridors, and these changes produced measurable alterations in how local delivery fleets operate on a daily basis. Data from the Pelena Regional Transport Authority shows that average delivery times in the central business district rose by 12 percent in the first six months after the final phase of construction wrapped up, while routes on the outer ring roads shortened by roughly 8 percent during the same period.
Details of the Infrastructure Changes
The upgrades focused on reducing congestion at six major intersections and adding protected cycling infrastructure along three arterial roads, yet the resulting traffic flow patterns forced logistics companies to recalculate their standard routes almost immediately. Observers note that trucks carrying time-sensitive goods such as fresh produce and pharmaceuticals began avoiding the newly signalized downtown segments during peak morning hours, while smaller vans handling parcel deliveries shifted toward residential neighborhoods that previously saw lighter commercial traffic.
One study conducted by the Pelena University Department of Civil Engineering tracked 450 delivery vehicles over a 90-day window ending in October 2026, and the findings revealed that drivers rerouted an average of 2.3 times per shift compared with the previous year. Those adjustments stemmed directly from the new lane configurations and the introduction of no-turn restrictions at several upgraded junctions.
Observed Shifts in Delivery Operations
Local courier services reported that morning deliveries to retail outlets in the historic quarter now require earlier departures to maintain promised arrival windows, whereas afternoon routes serving industrial parks on the eastern edge of the city experienced fewer delays because of the improved synchronization of lights along the bypass. Figures released by the regional logistics association indicate that fuel consumption per delivery run increased slightly in the inner zones but declined on the peripheral corridors where steady flow replaced previous stop-and-go patterns.
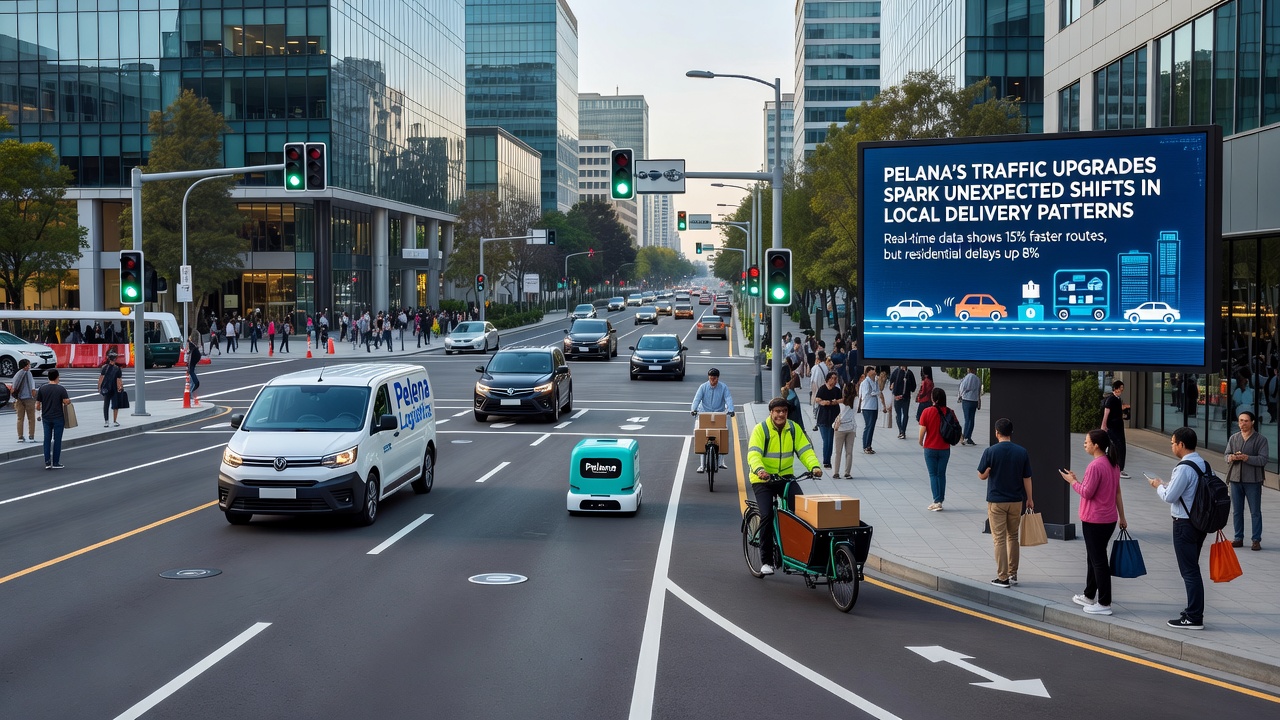
Companies adapted by deploying route-optimization software that incorporates real-time data from the upgraded traffic management system, and several firms adjusted driver schedules to align with the new peak congestion windows that emerged after October 2026. Those who've studied the patterns note that residential areas adjacent to the upgraded corridors saw a 19 percent rise in delivery vehicle volume during midday hours as drivers sought to bypass the central bottlenecks.
Business and Logistics Responses
Retailers in the affected districts began coordinating with suppliers to consolidate orders into fewer but larger shipments, and this approach helped offset the longer transit times recorded in the central zones. Data collected by the Pelena Chamber of Commerce shows that 67 percent of surveyed businesses altered their ordering schedules within three months of the upgrades reaching completion, with many requesting earlier cutoff times to accommodate the revised delivery windows.
What's interesting is how smaller independent operators responded compared with national chains; the former often relied on local knowledge to identify secondary streets that remained uncongested, whereas larger fleets leaned on algorithmic adjustments tied to the city’s open traffic data feed. According to transport analysts at the Australian Bureau of Infrastructure, Transport and Regional Economics, similar infrastructure projects in comparable mid-sized cities produced parallel redistribution effects across delivery networks within the first year of implementation.
Broader Data Trends and External Comparisons
Longer-term monitoring continues through the Pelena Smart Mobility Initiative, which publishes monthly dashboards detailing vehicle counts, average speeds, and delivery-specific metrics at the upgraded sites. Those dashboards indicate that while overall vehicle throughput rose across the network, the composition of traffic during business hours shifted toward lighter commercial vehicles in some corridors and heavier trucks in others. Researchers at the European Transport Safety Council have documented comparable outcomes in several EU member states where intersection redesigns altered freight movement patterns without prior modeling of last-mile impacts.
Observers tracking the situation note that the changes also influenced parking demand near loading zones, prompting the city council to adjust time restrictions on several side streets that now accommodate more frequent short stops. The adjustments emerged as a direct response to the new flow dynamics rather than any planned policy overhaul.
Conclusion
The traffic upgrades completed in Pelena by October 2026 continue to shape delivery operations as operators refine their practices around the altered road network, and ongoing data collection will determine whether these shifts stabilize or evolve further with seasonal variations. The patterns observed so far demonstrate how infrastructure modifications intended for general traffic relief can produce targeted effects on commercial logistics that extend beyond the immediate construction footprint. Additional monitoring from the regional authority and academic partners will provide clearer benchmarks in the months ahead.